If you are preparing for the IELTS Speaking Part 2, you probably expect to talk about topics like hobbies, friends, or your hometown. But what happens if you get a task about describing a graph or chart?
Don’t worry — EnglishMasterz, the leading choice for IELTS coaching and English classes in Solapur, is here to guide you step-by-step!
In this blog, you’ll learn how to describe visual information confidently, boost your IELTS score, and avoid common mistakes.
Does IELTS Speaking Include Describing Graphs?
While describing graphs is a major part of IELTS Academic Writing Task 1, sometimes in IELTS Speaking Part 2, the cue card might ask you to describe information you noticed from a survey, a report, or even a social media post.
You could get a card like this:
Describe a piece of information you saw on a chart or graph.
You should say:
What it showed
Where you saw it
Why it was interesting
And explain your understanding of it.
Thus, being ready for describing a graph in IELTS can help you sound smart and confident during the speaking test.
How to Describe a Graph or Chart in IELTS Speaking
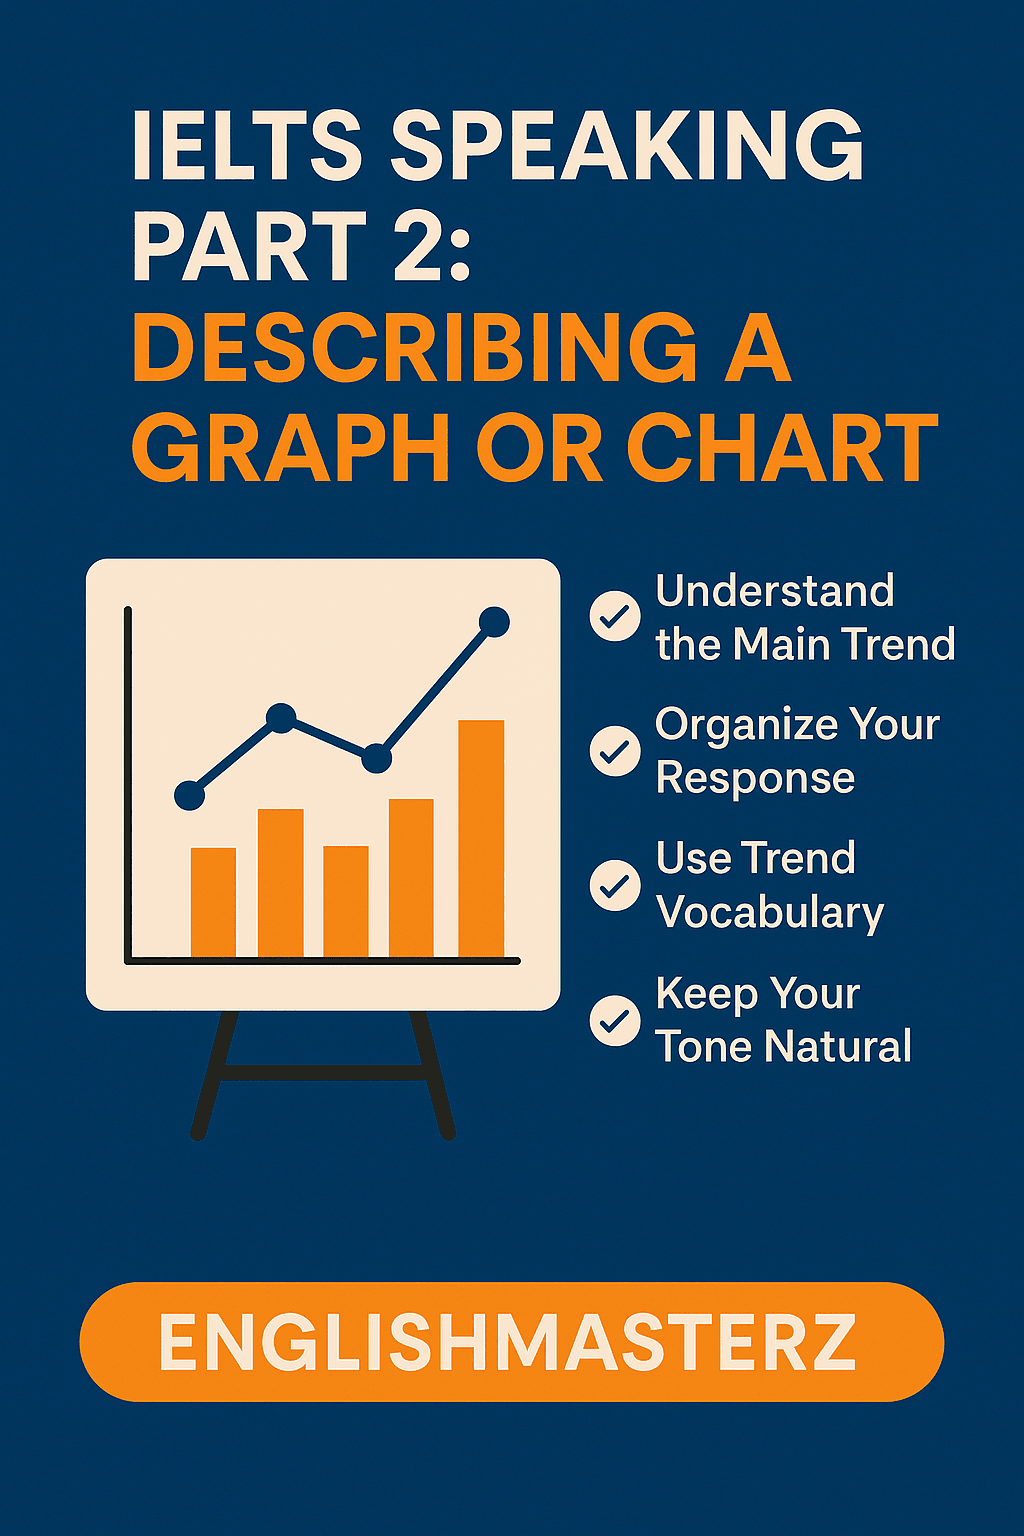
1. Understand the Overall Message
Focus on the main trend, not every tiny percentage.
Ask yourself:
Is it rising, falling, or stable?
Is there a dramatic change?
🔹 IELTS exam preparation tip: Think about what the graph is telling us overall instead of getting stuck on numbers.
2. Organize Your Speaking
For IELTS Speaking Part 2, structure your answer like this:
Introduction – Quickly say what the graph was about.
Main Details – Pick 2-3 important trends.
Interpretation – Explain why the changes matter.
Personal Connection – Share your thoughts or feelings.
🔹 IELTS coaching secret: Examiners love logical flow and clarity more than big vocabulary!

3. Use Trend Vocabulary Smartly
Here are useful words to impress your examiner during IELTS Speaking Part 2:
Verbs for Trends: Increased, decreased, fluctuated, remained stable
Adjectives: Sharp, gradual, dramatic, slight
Comparison Phrases: Higher than, similar to, in contrast to
🔹 EnglishMasterz Solapur tip: Practice a few phrases daily to make them sound natural, not memorized.
4. Keep Your Tone Natural and Conversational
In IELTS Speaking, you’re having a conversation, not giving a university lecture.
Speak like you’re explaining something interesting to a friend:
“The number of online shoppers shot up in just two years, which I thought was crazy!”
🔹 IELTS exam preparation reminder: Being genuine makes you more fluent and impressive.
Mistakes to Avoid When Describing a Graph
❌ Just listing numbers — It’s boring and hard to follow.
❌ Speaking too formally — Keep it real and lively.
❌ Ignoring your opinions — Always include your thoughts or reactions.
🔹 Pro tip from EnglishMasterz: Examiners reward candidates who give opinions clearly and confidently.
Practice Tip to Boost Your IELTS Speaking Part 2
Choose any random graph from Google.
Spend:
1 minute planning
2 minutes speaking Record yourself — and watch how you naturally improve describing trends, percentages, and patterns.
🔹 Join English classes in Solapur with EnglishMasterz if you want expert feedback on your practice!
Why EnglishMasterz is Your Best Partner for IELTS Exam Preparation
📚 Specialized coaching for IELTS Academic and General Training
🎯 Unique focus on IELTS Speaking Part 2
🌍 Real-life mock interviews
🏆 Trained by certified experts
📍 Based in Solapur with offline and online IELTS classes
Whether you are looking for English classes in Solapur or complete IELTS exam preparation, EnglishMasterz helps you learn smarter and score higher.
FAQs on IELTS Speaking and Describing Graphs
❓ Can a graph or chart really come in IELTS Speaking Part 2?
It’s rare but possible. You may be asked to describe visual information you noticed somewhere.
❓ How do I describe a trend without sounding boring?
Focus on overall changes, big contrasts, and give personal opinions. Keep it lively!
❓ Is it better to use percentages and numbers?
Mention a few numbers if needed, but always focus more on trends and reasons behind them.
❓ How can EnglishMasterz Solapur help me in IELTS?
We offer personalized strategies, speaking mock tests, and professional feedback to help you speak naturally and confidently.
Ready to Ace IELTS Speaking Part 2?
✨ Master describing graphs and charts in IELTS with EnglishMasterz!
✨ Learn through expert-designed IELTS classes Solapur.
✨ Book your FREE Demo Class today!
🌐 Visit: www.englishmasterz.com
📩 Email: info@englishmasterz.com
